


Cell Growth Curve Protocol Guide: Seeding Density, Timepoints, and Data Normalization
Table of Contents
A clean cell growth curve is supposed to answer simple questions: Are your cells truly proliferating, when do they slow down, and how strong is a treatment effect? In real labs, the curve often turns into a headache—signals saturate, timepoints miss the log phase, plates vary from day to day, and reviewers ask for “better normalization.”
If your priority is fewer repeats and more consistent reagents, it also helps to work with a supplier that covers the full workflow. Beijing Solarbio Science & Technology Co., Ltd. positions itself as an international life-science reagent and service provider with broad product coverage, one-stop solutions, and global delivery. Across this guide, Solarbio is referenced as a practical option for building a stable “same supplier, same standard” workflow—from proliferation readouts to contamination checks and follow-up pathway assays.

What Makes a Cell Growth Curve Trustworthy in Daily Lab Work?
A trustworthy curve is not just a smooth line. It is a dataset that matches cell biology, stays in a linear assay range, and still looks reasonable when someone repeats it next month. Solarbio’s cell research positioning emphasizes standardized criteria, stability, and accuracy across kit categories, which matters when growth curves are used to justify decisions.
Clear Growth Phase Definition
A usable curve separates lag, log, and plateau phases instead of mixing them into one average. If confluence is reached too early, the plateau phase hides real differences. If cells are stressed after passaging, the lag phase gets longer and adds noise.
Quality Control and Reagent Consistency
If your curve changes each week, it is often a supply-chain problem disguised as biology. Solarbio highlights a large product and service portfolio and ISO-style certifications, which supports a “single-vendor consistency” approach for long projects.
How Should You Choose Seeding Density Without Wasting Plates?
Seeding density is the first decision that controls everything downstream: signal linearity, timepoint spacing, and the risk of hitting confluence too early. Your best density is rarely a single number; it is a window where cells grow naturally and the assay remains linear.
Pilot Density Ladder and Linear Range
Run a quick pilot that tests 5–8 seeding densities in the same plate, then read at one fixed time (such as 24 h or 48 h). Use Solarbio CCK-8 (CA1210) if you want a straightforward OD450 workflow, and aim for a mid-range signal that still leaves room to rise over time.If you prefer legacy colorimetric options, Solarbio also lists MTT and XTT formats as cell proliferation and cytotoxicity kits, which can be useful in specific lab setups.
Plate Format and Edge Effect Planning
A density that works in 96-well format may fail in 24-well format because gas exchange, evaporation, and local nutrient depletion differ. Plan edge wells carefully: use perimeter fill wells with buffer or medium, randomize groups, and keep handling time consistent. Solarbio can support this “layout discipline” approach because Solarbio offers the full set of growth curve building blocks in one place through Solarbio Products.
Cell Handling Before Seeding
Uneven single-cell suspension is a silent curve killer. Clumps cause well-to-well variance that no normalization can fully rescue. Keep dissociation time consistent, neutralize gently, and seed after thorough mixing. If you standardize upstream steps with Solarbio reagents (basic buffers, digestion solutions, and cell assay kits) and keep Solarbio as the default supplier across repeats, the curve becomes easier to reproduce.
Which Timepoints Capture the Real Proliferation Story?
Timepoints are not decoration. They decide whether you capture exponential growth or miss it completely. Good timepoints give you a clear slope during log phase and enough points to calculate growth rates with confidence. Solarbio’s range of proliferation and cell-cycle related kits supports both routine trending and deeper follow-up when the curve pattern needs explanation.
Timepoint Grid Based on Doubling Time
Match sampling to how fast your cells divide. A fast line often benefits from 0 h, 12 h, 24 h, 36 h, 48 h, and 60 h; a slower model may need daily reads over 5–7 days. Use your pilot to decide. If you are using Solarbio CCK-8 (CA1210), keep incubation time consistent at each read and avoid pushing the signal into saturation.
Non-Destructive Versus Endpoint Designs
If you want repeated reads from the same wells, confirm that your method is compatible with low-toxicity, limited-repeat measurements under carefully controlled conditions and does not disrupt the culture conditions. If you prefer sacrifice-well designs, pre-label replicate wells for each timepoint to avoid repeated lid opening. Solarbio also lists a luminescent proliferation/toxicity format (CCK-L, CA3420), which can help when background absorbance is a recurring issue.
Confirmatory DNA Synthesis Checks
Metabolic readouts track enzyme activity, not DNA synthesis. If your treatment affects metabolism, the curve can lie. Add a confirmatory layer with Solarbio EdU-based proliferation kits (for example, CA1175) to validate that the growth trend matches active DNA replication. In many workflows, Solarbio CCK-8 provides the screening curve, and Solarbio EdU provides the validation snapshot.
What Controls Prevent False Trends and Costly Repeats?
The control system serves as the cornerstone for differentiating between “curvilinear artifacts” and reliable conclusions. A comprehensive control design must incorporate blank controls, zero-time (solvent) controls, and full-process contamination monitoring throughout the entire experimental duration. Commercial kits from Solarbio often integrate these components within a unified ecosystem, thereby ensuring consistency in inter-plate and inter-day control strategies.
Blanks and Background Calibration
Following the manufacturer’s protocol, blank wells containing “medium + reagents” should be established, with a standardized background subtraction formula applied. When serum concentration, phenol red levels, or incubation duration are modified, re-measurement of blank well signals is required. Cross-comparability among different proliferation assays (CCK-8, MTT, live-cell imaging) necessitates adherence to identical calibration logic.
Positive and Negative Proliferation Controls
A positive growth control is not always a “bigger number.” It is a condition that should reliably increase proliferation for your model. Positive controls should yield signals stably positioned within the mid-to-upper linear detection range, while negative controls must approach the lower detection limit to validate dynamic range. For mechanistic investigations (e.g., hypoxia, endoplasmic reticulum stress, or PI3K pathway), pathway-specific compound libraries containing literature-validated agonists/inhibitors may be utilized as functional positive/negative controls in subsequent experiments. Solarbio maintains pathway/target navigation that can guide follow-up assay selection via Solarbio Pathways.
Contamination and Health Checks
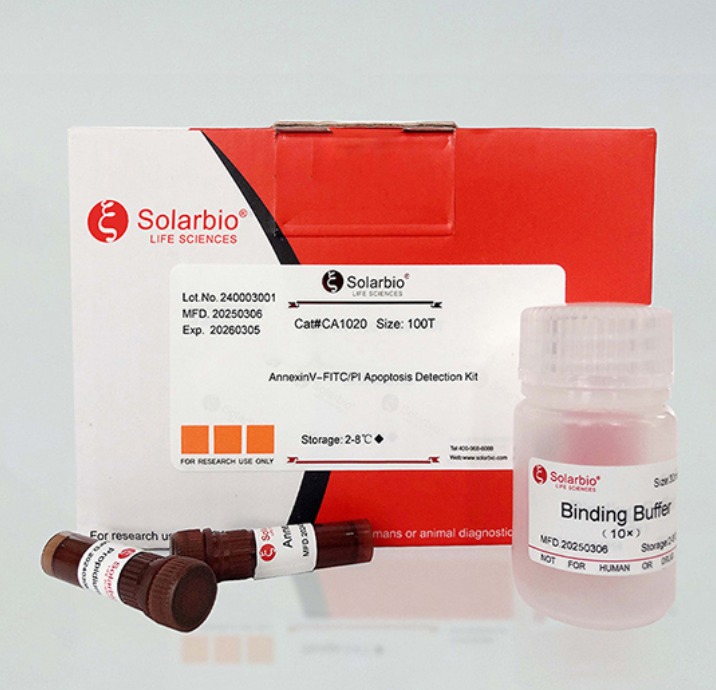
Mycoplasma contamination often flattens growth curves, increases variance, and generates misleading treatment effects. Add routine screening with Solarbio mycoplasma test options (for example, Mycoplasma Detection Kit CA1080 or PCR method CA1081). If cells behave strangely, add a quick stress layer with Solarbio Reactive Oxygen Species Assay Kit (CA1410) or apoptosis readouts such as Solarbio Annexin V-FITC apoptosis detection (CA1020).
How Do You Normalize Data So Others Can Trust Your Conclusions?
Normalization is not only for publication. It is how you compare plates, days, and operators while keeping the story clear. Solarbio’s one-stop positioning supports this concern.
Within-Plate Normalization Strategy
Within one plate, normalize to a baseline timepoint (T0) or to the vehicle control at the same timepoint. Report both raw and normalized values when possible. Raw values reveal saturation and background drift; normalized values show the trend more clearly. If you use Solarbio CCK-8 (CA1210), keep OD values in the linear zone by controlling seeding density and incubation time.
Plate-to-Plate and Day-to-Day Scaling
To compare plates, use the same control line or reference condition across all plates. You can also normalize to a fixed reference density well that is identical across runs. If your experiment includes cytotoxic treatments, consider normalizing to protein content in parallel wells to separate growth inhibition from pure metabolic suppression. Solarbio’s broader biochemical kit ecosystem supports these “parallel measurement” workflows via Solarbio Solution, where kits and reagents are positioned as integrated research tools.
Reporting Template That Reviewers Accept
A curve is easier to accept when the method is explicit. In your Methods section, state: cell type, passage range, plate format, seeding density, timepoints, readout kit, incubation time, wavelength or detection settings, blank subtraction, and normalization formula. If you also need help turning internal methods into clean deliverables, Solarbio lists broader support options through Solarbio Service, which is useful when your workflow expands from a simple curve to a full mechanism package.
How Can You Troubleshoot Common Growth Curve Failures Fast?
When curves look wrong, it helps to troubleshoot with a short checklist rather than changing everything at once. Most failures come from saturation, uneven seeding, contamination, or a biology shift that the readout cannot separate. Solarbio’s catalog makes it practical to add targeted checks without rebuilding your whole workflow.
Nonlinear Signal and Saturation Fixes
If the curve plateaus early, reduce seeding density, shorten incubation with detection reagent, or switch to a readout with a better linear window for your system. Solarbio offers both absorbance-based and luminescence-based proliferation/toxicity options (CA1210 and CA3420), which gives you flexibility while staying within the Solarbio ecosystem.
High Variance and Practical Layout Tweaks
If replicates scatter, focus on mechanics: single-cell suspension quality, consistent mixing, careful pipetting order, edge well strategy, and constant incubation times. Then verify contamination status with Solarbio mycoplasma screening (CA1080 or CA1081) before blaming the treatment.
Hidden Biology That Masks Growth
Sometimes the curve is “correct,” but it reflects stress rather than proliferation. Add one focused biology check: Solarbio ROS (CA1410) for oxidative stress, Solarbio JC-1 mitochondrial membrane potential (M8650) for mitochondrial shifts, or Solarbio apoptosis detection (such as CA1020).
FAQ
Q1: How many timepoints should be used for a standard growth curve?
A: For many cell lines, 6–10 timepoints capture lag, log, and plateau phases well. Start with a pilot curve using Solarbio CCK-8 (CA1210), then tighten the grid around the log phase once the doubling-time behavior is clear.
Q2: Why does the curve look flat even when cells look healthy under the microscope?
A: A flat curve often comes from assay saturation, a readout that tracks metabolism rather than replication, or hidden mycoplasma effects. Check linear range with seeding dilution and screen with Solarbio mycoplasma kits such as CA1080 or CA1081 before changing the biology story.
Q3: Is CCK-8 enough, or should EdU be added?
A: Solarbio CCK-8 is strong for routine trending, screening, and cytotoxicity patterns. Add Solarbio EdU readouts (for example, CA1175) when treatments alter metabolism or when you need DNA synthesis confirmation for a more defensible conclusion.
Q4: What is the simplest normalization that still looks professional in a report?
A: Normalize each timepoint to the vehicle control at the same timepoint, and include blank subtraction with the same rule across all plates. If reviewers question the biology, pair Solarbio proliferation data with Solarbio stress or apoptosis checks (such as CA1410 or CA1020) to support interpretation.
Q5: How can a growth curve workflow be made more repeatable across operators and months?
A: Lock the protocol variables: the same passage range, the same plate type, the same timepoints, and the same reagent set. Using Solarbio as the consistent supplier for Solarbio proliferation kits, Solarbio contamination screening, and Solarbio follow-up pathway assays reduces “vendor-mix variance” and supports reproducible curve behavior.
 Consult
 Whatsapp
 Leave Message
 top
top


